Sunday, February 26, 2012

The Oceans Sciences Conference 2012, Salt Lake City, Utah

My first conference! Oh, and I gave a talk! Maybe you missed that. I got the incredible opportunity to present my research at a major international conference. Needless to say I was excited... but mostly terribly nervous.
I submitted my abstract in October, with the full anticipation that I'd be assigned a poster. It's not very common for an undergrad to get a talk, so I wasn't expecting much. Honestly I just hoped my abstract would be accepted. In November I got the email that I was given a speaker slot, and I was instantaneously on cloud-9. But as November melted into December and December into January, the nerves started to take hold. I was going to be surrounded by these pillars of science, the experts that I cite endlessly in any paper or presentation. I needed to prepare. 
Flying in to Salt Lake City
I got into Salt Lake City last Saturday, not nearly as prepared as I wanted to be. On the plane over, I suddenly got this crazed new idea for the direction I wanted to go in, and began completely reorganizing my talk. This was probably not a good idea. So night one consisted of me endlessly tweaking my talk.

On Sunday, with fresh powder on the ground, my advisor, another researcher, and I decided to go skiing. Avoid the stress of my talk for a couple hours (maybe it was just procrastination). My advisor and his colleague were originally from the mainland and had been skiing since forever. In contrast, this would be the third time I had ever seen snow. I had been snowboarding once before so I stuck with that. The geography was incredible on the way up to Brighton.
Heading up to Brighton
Snowboarding was incredibly fun but also pretty painful. I managed to not fall getting off the lifts, but that's just about the only place I didn't fall. Trying to keep up with two experienced skiers is not the safest thing to do when you're on a snowboard for the second time in your entire life. I would get into the flow of it, get some good speed, then promptly catch an edge and fall. I fell pretty hard a couple of times, but I just kept wanting to go fast. By the third run, my advisor and his friend had ditched me and I was on my own, so I plugged in my iPod and just listened to music for the rest of the day as I explored the runs. Music and snowboarding is so much better than just snowboarding. It was more fun and I felt like I fell less for some reason. I'd just tune out and then suddenly I'd be at the bottom of the hill, lining up for the lift again.

Starting out...

Something a little steeper. 
Heading back to the city
That night a number of my labmates flew in so the house quickly became filled. And by filled I mean overbooked. Some of us had to sleep two to a bed (luckily they were queen sized beds!). Everyone was some combination of excited, nervous, and jet-lagged. For dinner we grilled up some sort of pork, some flounder, asparagus, and potatoes. Being the 'rabbit' that I am, I stuck with the veggies. 

Day 1 of the conference was exciting! The Salt Palace Convention Center is huge and I spent most of the morning wandering around various ballrooms. Thousands of people were in attendance, filling in and out of ballrooms as they attempted to see every talk of interest. This was impossible to me as so many cool talks were going on at the same time. I sat in on a session entitled "137: Biodiversity, Biogeochemistry and Ecology: Establishing Linkages Between Molecular Diversity and Ecosystem Functioning" and another called: "004: The Southern Ocean and Its Role in the Climate System."

Sitting in one of the talks...

Massive poster sessions!
Days 2 and 3 were a blur. Endlessly sitting in talks, then frantically speeding to the next one in the ballroom across the entire building. Day 3, Wednesday, was filled with plenary talks an there was a really interesting one about shark conservation and the impacts of the shark fin soup industry. 

Day 4. Before I knew it, Thursday was here. The day of my talk. There was an entire session devoted to the type of work I'd be presenting: compound specific isotope analysis of amino acids (AA-CSIA): 123: Compound-specific amino acid analysis: a rapidly evolving tool for ecology, paleoceanography and biogeochemical cycle research. The line up of speakers was amazing. Marylin Fogel, the opening speaker, basically pioneered this entire method over 20 years ago. Other big names included Matt McCarthy, Yoshito Chikaraishi, and my advisor Brian Popp. Put simply, this room was filled with anyone who understood the AA-CSIA method. And here I was, fresh out of my undergraduate life, with a B.S. in Global Environmental Science. The talks started at 8:00 am and I didn't talk until 10:45, so I had plenty of time to work up my nerves. I had to keep telling myself to think of Max (a dog) who lives a stress free life. 

On top of the sheer stress that comes from having to give a presentation to an audience of experts, I had two additional reasons to worry:

1) Both of my prospective advisors for grad school were in attendance, so this almost felt like a job interview. 

2) My talk was essentially going against everything that the guy presenting before me was supporting. And the guy before me was Yoshito Chikaraishi, one of the biggest names in this type of science. 

But you know what, I did it! I could feel my voice shaking a bit, but it wasn't bad. I knew my stuff and I could feel the repetition taking over as I settled into it. And I did alright! I didn't really get any difficult questions after, so I felt pretty good. After I sat back down, all the adrenaline left and I suddenly felt exhausted yet elated. It was over!

The poster session started at 4 pm every day and there was free beer for the first hour. I hadn't really taken advantage of this until now. I had to celebrate!
Title slide of my talk
The end of Friday's sessions at 4 pm marked the close of my first conference. It was a rush. A crazed, stressful, amazing rush. Now it's on to writing an abstract for an upcoming conference! It never ends. 

Here are some pics of the city: 

Mormon temple

The capitol building

Inside the capitol building
Beautiful ceiling, Capitol building

View from the top! Salt Lake City

See you at the next conference!


Sunday, October 2, 2011

Monte Carlo integration: How the number of iterations used affects precision

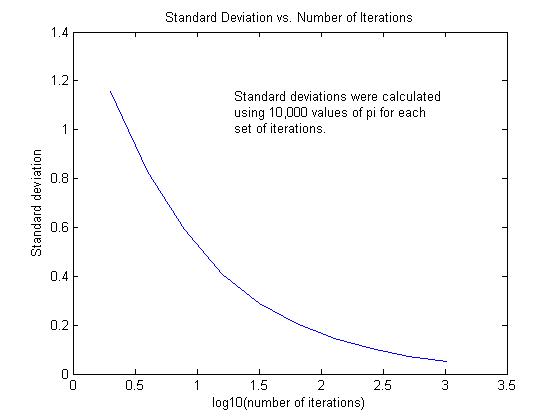
While it may be obvious that with Monte Carlo integration, the more iterations performed will result in higher precision, it's always fun to look at something graphically. Since I had already written a program that approximated the value of pi (check it out here), I decided to look at how standard deviations change with increasing numbers of iterations.

I chose to run 10 sets of iterations: 2, 4, 8, 32, 64, 128, 256, 512, and 1024. Why these values were chosen becomes obvious in the script, but you can use any set of iterations you want. Each set of iterations was run 10,000 times and standard deviations were calculated from these.
Figure 1: Stdev vs. number of iterations. Note the x-axis is log scale so that the trend can more easily be seen.
Here's my script:

% Graphing standard deviations of pi vs. number of iterations
% using Monte Carlo integration
close all
clear all

for x = 1:10;           
   
y=2^x;
   
for i = 1:10000;
    n = 2*(rand(2,y))- 1;    % generates random numbers between -1 and 1
   
    pts = 0;                  % starting value for total points
    circ = 0;                 % starting value for points within circle
   
    for R = 1:y;
        d = sqrt((n(1,R))^2 + (n(2,R))^2);
        pts = pts + 1;
        if d <= 1;
            circ = circ + 1;
        end  
    end
    Pi(1,i) = (4*circ)/pts;

end

STD(1,x) = std(Pi);
IT(1,x) = y;

end

plot (log10(IT),STD)
title('Standard Deviation vs. Number of Iterations');
xlabel('log10(number of iterations)');
ylabel('Standard deviation');

Saturday, October 1, 2011

Calculating Pi: Monte Carlo Integration

Thank you physicists, Matlab, and (pseudo)random number generators. Welcome to Monte Carlo integration. A couple of days ago, my boyfriend was telling me how he has surpassed me in his Matlab skills. Dorky, I know.  Not one to be bettered, I set out to prove him wrong. He had an assignment to approximate the value of pi using Monte Carlo integration in C. I'd do it in Matlab.

But I had to figure out what Monte Carlo integration was first.

Enter Wikipedia. I don't care what professors say about it, Wikipedia is a magical place filled with more knowledge than could ever be stuffed into my head. I'm not going to start citing the website in anything important, but I will give it my thanks. So here it is: Monte Carlo integration offers an approximate evaluation of definite integrals using random numbers.   

So what did I have to do exactly? My bf gave me a hint: use a circle and a square. After some more prodding he added, "put the circle in the square." Alright. Thanks a lot.

So I drew up a circle with radius = 1, inside a square with sides = 2 (Figure 1).


Figure 1: Circle with radius = 1 within a square with sides = 2.
We know that the area of the square is L2= 22 = 4.

We know the area of the circle is
A = πr2. To find π, we need to know the area of the circle. Unfortunately, that's impossible to know without π.

But there is another way to find pi. I first set the center of the circle as (0,0) in a coordinate plane. I then could generate sets of random numbers between -1 and 1 and use these as x and y coordinates. Using Pythagorean's Theorem I can find the distance of these points from the center (the origin):

c = √(a2 + b2).

If a point's distance from the origin is < 1, then it falls within the circle. The ratio of points within the circle to the total number of points (points within the square) is proportionate to the ratio of the area of the circle to the area of the square:

                                               # points in circle   =    Ï€r2           where r=1
                                                # points total             4
So:    

                                              Ï€    =    4(# points in circle)
                                                              # points total
With that in mind, my Matlab adventure began.

The script was pretty easy to write (find it at the bottom of this page). The hardest part for me was actually plotting the figure. Obviously, the more iterations (# of points) you do, the more accurate your result will be (Table 1). It also vastly increases the computing time. Past 1,000,000 iterations, my Matlab program got pissed and said it didn't have enough memory.


# of Iterations
Approximate value of Pi
10
2.4
100
3.24
1000
3.092
10000
3.1104
100000
3.13168
1000000
3.143080


Here's my Matlab script for 1000 iterations:

% Calculating pi using Monte Carlo integration
close all
clear all

n = 2*(rand(2,1000))- 1;        % generates random numbers between -1 and 1
t=sum(n.*n,1)<1;
pts = 0;                       % starting value for total points
circ = 0;                      % starting value for points within circle

for R = 1:1000;
    d = sqrt((n(1,R))^2 + (n(2,R))^2);
    pts = pts + 1;
    if d <= 1;
        circ = circ + 1;
    end
end

format long
Pi = (4*circ)/pts

plot(n(1,~t),n(2,~t),'b.','MarkerSize',15)
hold on
plot(n(1,t),n(2,t),'r.','MarkerSize',15)

theta = linspace(0,2*pi,100);    
x = cos(theta);                 
y = sin(theta);                  
plot(x,y,'k'); 
axis ('equal');
axis([-1 1 -1 1]);
title('100 Iterations');

Monday, September 26, 2011

Trawling the deep: aliens in our bathtub


I recently went on a research cruise in the Pacific ocean, trawling, deploying CTDs, and (scientific) fishing. Here are just a few of the organisms we pulled up from our own salty bathtub.
Posted by Picasa

Trawling the Deep: aliens in our bathtub

I think I'll just let the pictures do the talking.


Posted by Picasa

Saturday, September 10, 2011

Open ocean aquaculture: what's the problem?


"Look out Hawaii! Open ocean aquaculture (OOA) has many problems," warns Neil Frazer, professor of geophysics at UH Manoa. Focusing on the new OOA system off the Big Island, Frazer cites multiple shortcomings of the system in his November 2010 article to the Honolulu Star Advertiser. First, he argues OOA of carnivorous fish is "worse than over-fishing" because production of these fish requires massive amounts of food in the form of wild caught fish; fish that would otherwise be feeding people of Third World countries. Second, farmed fish have higher levels of pollutants than wild caught fish. Third, sewage from these caged fish negatively impacts the ocean environment. He further argues that OOA can act as an agent of disease for wild populations of fish. Wild fish would starve or get eaten when they fall ill. However there are no predation or starvation pressures on these caged fish, allowing them to spread disease over long periods of time. 

One of his arguments stood in stark opposition to what we had heard in the aquaculture class I'm taking this semester: the sewage issue. In class we learned one of the pros of offshore, open-ocean cages was that you did not have to worry about waste products. The waste would be distributed by oceanic currents and diluted thanks to the massive expanse of the ocean itself. No worries, right? Frazer argues dilution is not the solution; it just becomes someone else’s problem. These differing opinions I believe are a result of each person’s different experiences with aquaculture. My professor is speaking from an aquaculturist’s point of view. Someone who has been in the business to do just that: business. After all, aquaculture is a business, not a science. Frazer’s viewpoint is that of an observer, a possible consumer (although not likely judging by the article). His interests lie with environmental well-being, not with making money. Both opinions are valid; they just come from differing points of view.
In oligotrophic and relatively fast moving waters like Hawaii, I don’t think a few OOA operations would be a problem. The added nutrients from the waste may add to increase in primary productivity, but not much. And would increasing primary productivity a bit be such a bad thing? It may increase food availability for higher trophic position fishes, commercially important fishes. Could OOA increase wild stock biomass? Further, the cages themselves may attract fish, providing refuge in an otherwise featureless environment. This is an observed phenomenon; buoys miles from the islands have been found to attract fishes in larger concentrations than they’d be otherwise.
The promotion of disease in wild stocks is one of Frazer’s most troubling arguments. By protecting and feeding sick fish, OOA cages are a “reservoir of infection.” Diseases among caged fish could transfer to wild populations. Further, Frazer worries some caged fish escape the nets and interbreed with wild stocks, lowering the genetic robustness of the population. Is it possible that OOA is hurting populations of wild fish?
Frazer ends the article by talking about the advantages of Native Hawaiian fishponds and seems to suggest we should be using that aquaculture method rather than OOA. But could we support our demand for aquatic protein entirely from fishponds? What Frazer fails to mention is that the Native Hawaiian population was much smaller than Hawaii's population today, and even with that smaller population it is highly unlikely they were able to provide for themselves enough protein through fishponds.
I think we need to give OOA a chance. We are over-fishing our wild fish stocks and will soon need an alternative source of fish protein. Plus, OOA is far more sustainable and ecologically friendly than mass cattle, pig, and chicken production. Although we could all just become vegetarians and avoid this whole issue. Anyone?  
Check out the article here.